Combine two or more 'reliabilitydiag' objects that are based on the
same observations. Other objects are coerced by as.reliabilitydiag
before combination.
Arguments
- ...
objects to be concatenated.
- tol
accuracy when comparing
yin'reliabilitydiag'objects.- xtype
a string specifying whether the prediction values should be treated as
"continuous"or"discrete".- xvalues
a numeric vector of possible prediction values; values in
xare rounded to the nearest value inxvaluesandxtypeis set to"discrete".- region.level
a value in (0, 1) specifying the level at which consistency or confidence regions are calculated.
- region.method
a string specifying whether
"resampling","continuous_asymptotics", or"discrete_asymptotics"are used to calculate consistency/confidence regions.- region.position
a string specifying whether consistency regions around the
"diagonal"or confidence regions around the"estimate"are calculated.- n.boot
the number of bootstrap samples when
region.method == "resampling".
Value
an object inheriting from the class 'reliabilitydiag'.
See also
Examples
data("precip_Niamey_2016", package = "reliabilitydiag")
X <- precip_Niamey_2016[c("EMOS", "ENS")]
Y <- precip_Niamey_2016$obs
r0 <- reliabilitydiag0(Y)
r1 <- c(r0, X, EPC = precip_Niamey_2016$EPC, region.level = NA)
r1
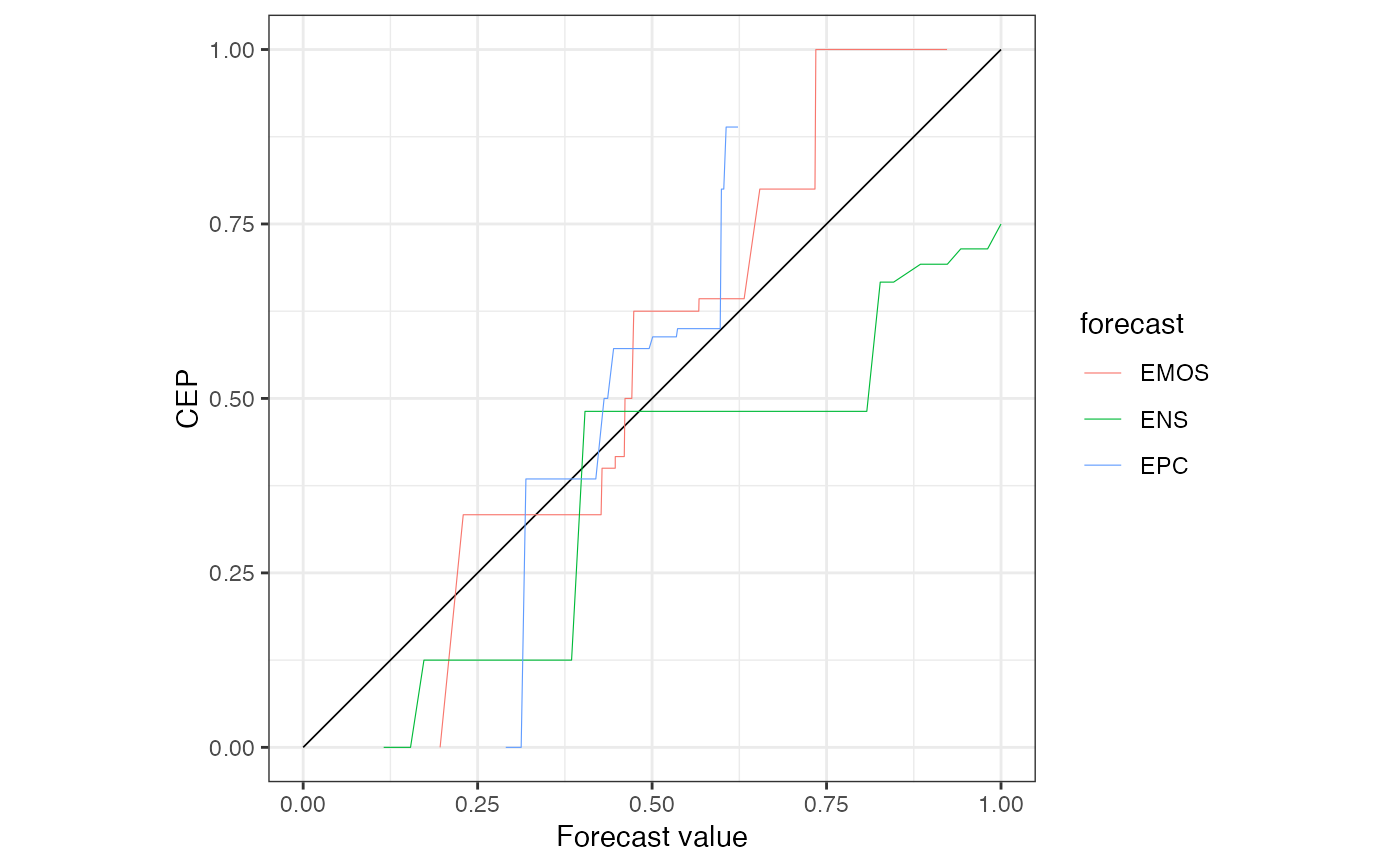 #> 'brier' score decomposition (see also ?summary.reliabilitydiag)
#> # A tibble: 3 × 5
#> forecast mean_score miscalibration discrimination uncertainty
#> <chr> <dbl> <dbl> <dbl> <dbl>
#> 1 EMOS 0.232 0.0183 0.0305 0.244
#> 2 ENS 0.266 0.0661 0.0441 0.244
#> 3 EPC 0.234 0.0223 0.0323 0.244
c(r1, reliabilitydiag(Logistic = precip_Niamey_2016$Logistic, y = Y))
#> 'brier' score decomposition (see also ?summary.reliabilitydiag)
#> # A tibble: 3 × 5
#> forecast mean_score miscalibration discrimination uncertainty
#> <chr> <dbl> <dbl> <dbl> <dbl>
#> 1 EMOS 0.232 0.0183 0.0305 0.244
#> 2 ENS 0.266 0.0661 0.0441 0.244
#> 3 EPC 0.234 0.0223 0.0323 0.244
c(r1, reliabilitydiag(Logistic = precip_Niamey_2016$Logistic, y = Y))
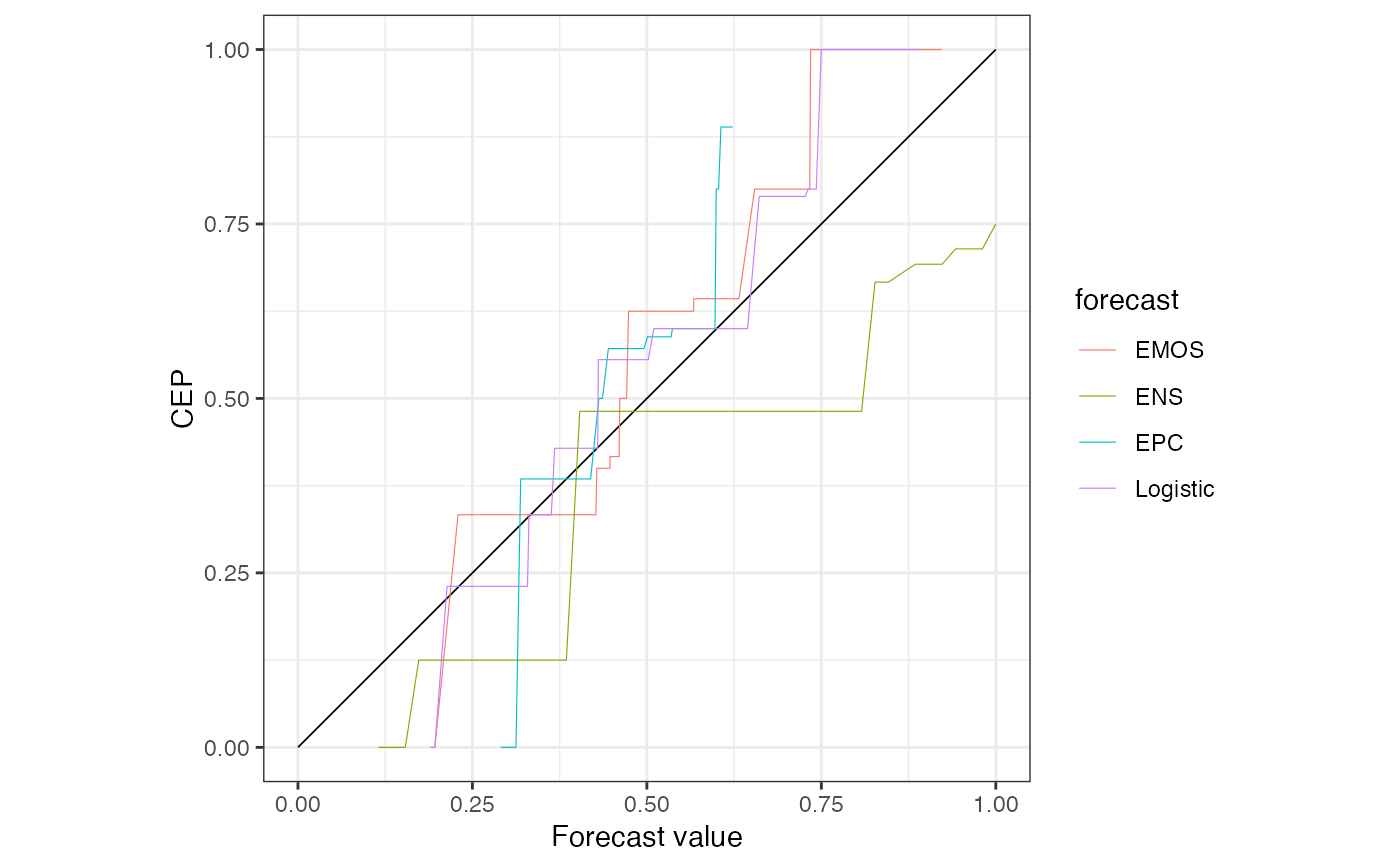 #> 'brier' score decomposition (see also ?summary.reliabilitydiag)
#> # A tibble: 4 × 5
#> forecast mean_score miscalibration discrimination uncertainty
#> <chr> <dbl> <dbl> <dbl> <dbl>
#> 1 EMOS 0.232 0.0183 0.0305 0.244
#> 2 ENS 0.266 0.0661 0.0441 0.244
#> 3 EPC 0.234 0.0223 0.0323 0.244
#> 4 Logistic 0.206 0.0171 0.0555 0.244
#> 'brier' score decomposition (see also ?summary.reliabilitydiag)
#> # A tibble: 4 × 5
#> forecast mean_score miscalibration discrimination uncertainty
#> <chr> <dbl> <dbl> <dbl> <dbl>
#> 1 EMOS 0.232 0.0183 0.0305 0.244
#> 2 ENS 0.266 0.0661 0.0441 0.244
#> 3 EPC 0.234 0.0223 0.0323 0.244
#> 4 Logistic 0.206 0.0171 0.0555 0.244