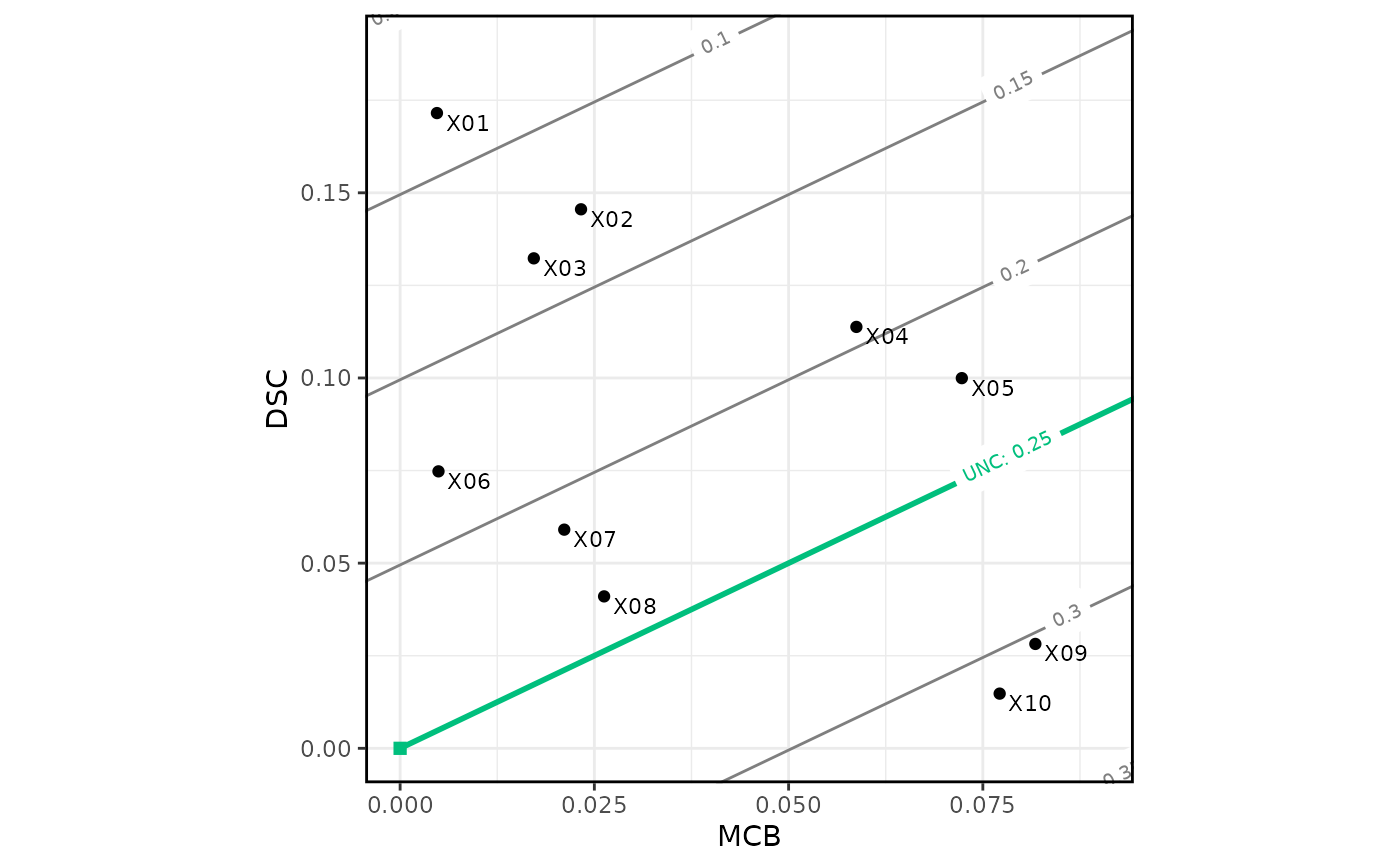
Plot methods for the triptych classes
Usage
# S3 method for triptych
plot(x, ...)

# S3 method for triptych
autoplot(object, ...)

# S3 method for triptych_murphy
plot(x, ...)

# S3 method for triptych_murphy
autoplot(object, ...)

# S3 method for triptych_reliability
plot(x, ...)

# S3 method for triptych_reliability
autoplot(object, ..., breaks = seq(0, 1, length.out = 11))

# S3 method for triptych_roc
plot(x, ...)

# S3 method for triptych_roc
autoplot(object, ...)

# S3 method for triptych_mcbdsc
plot(x, ...)

# S3 method for triptych_mcbdsc
autoplot(
  object,
  ...,
  n_isolines = 10,
  colour_values = "black",
  colour_unc = "#00BF7D",
  MCBDSC_repel = FALSE,
  MCB_lim = NA,
  DSC_lim = NA
)
Arguments
- x
An object that inherits from one of the triptych classes.
- ...
Arguments passed from
autoplot.triptych()to the other methods for triptych classes.- object
An object that inherits from one of the triptych classes.
- breaks
A vector of bin boundaries for the
geom_histogram()layer. Set toNAto disable.- n_isolines
The number of isolines showing mean scores.
- colour_values
A colour specification passed to the
valuesargument ofscale_colour_manual(). Recycled if length 1.- colour_unc
A colour specification highlighting the UNC component layers.
- MCBDSC_repel
A boolean value indicating whether labels should be placed by the
ggrepelpackage.- MCB_lim
The plot limits for the x-axis (the MCB component).
- DSC_lim
The plot limits for the y-axis (the DSC component).
Value
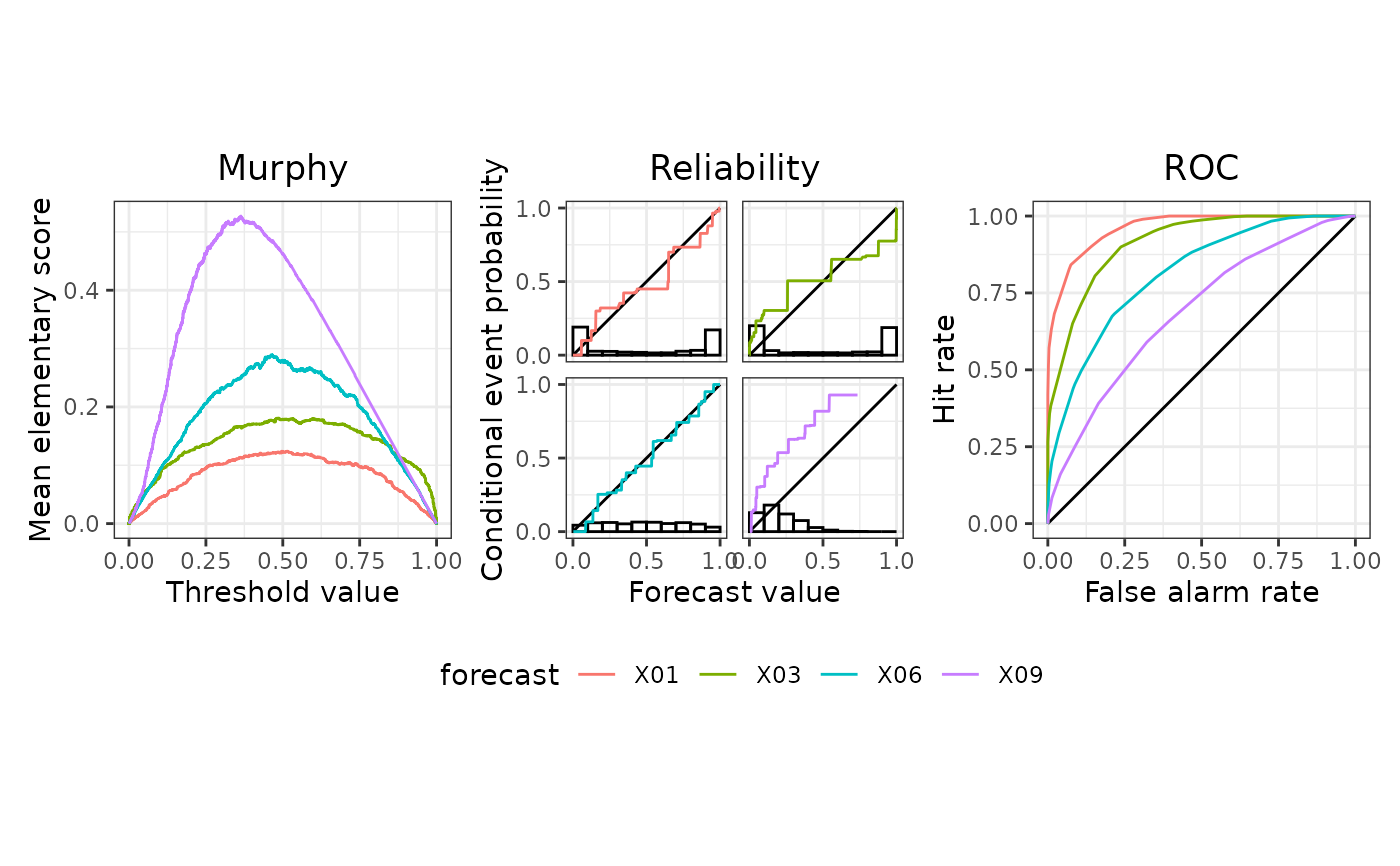
For an object of class 'triptych': A patchwork object (invisibly).
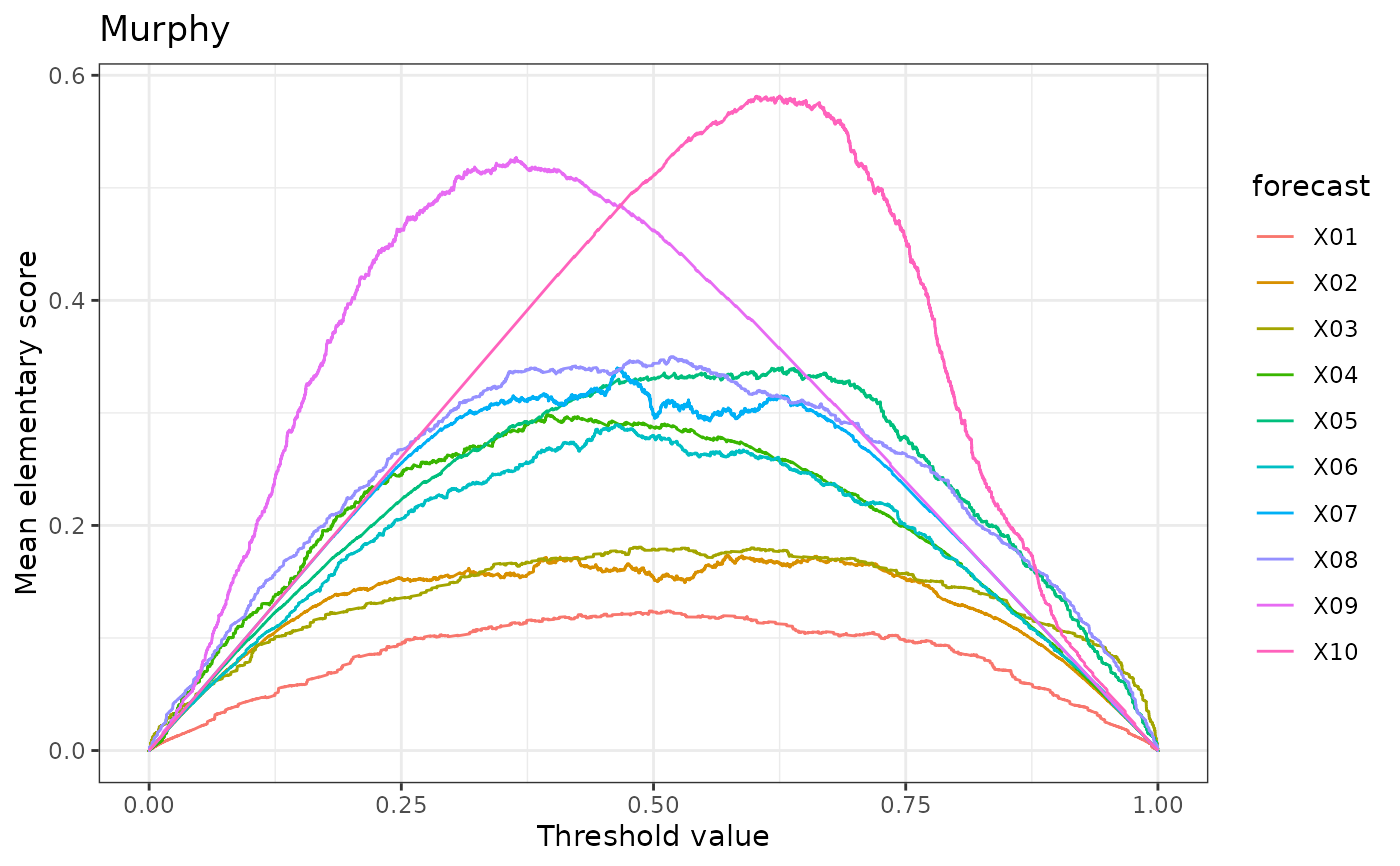
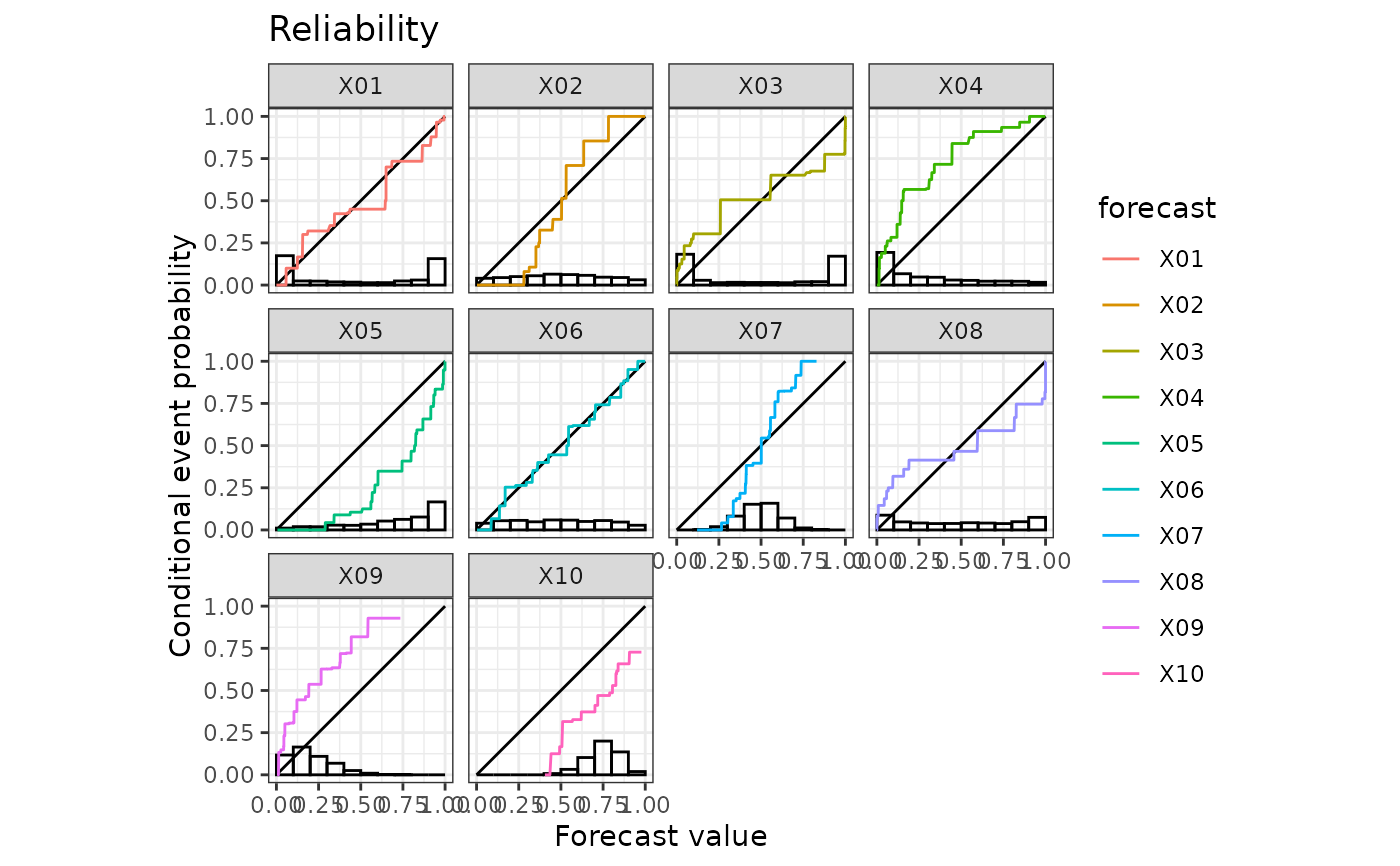
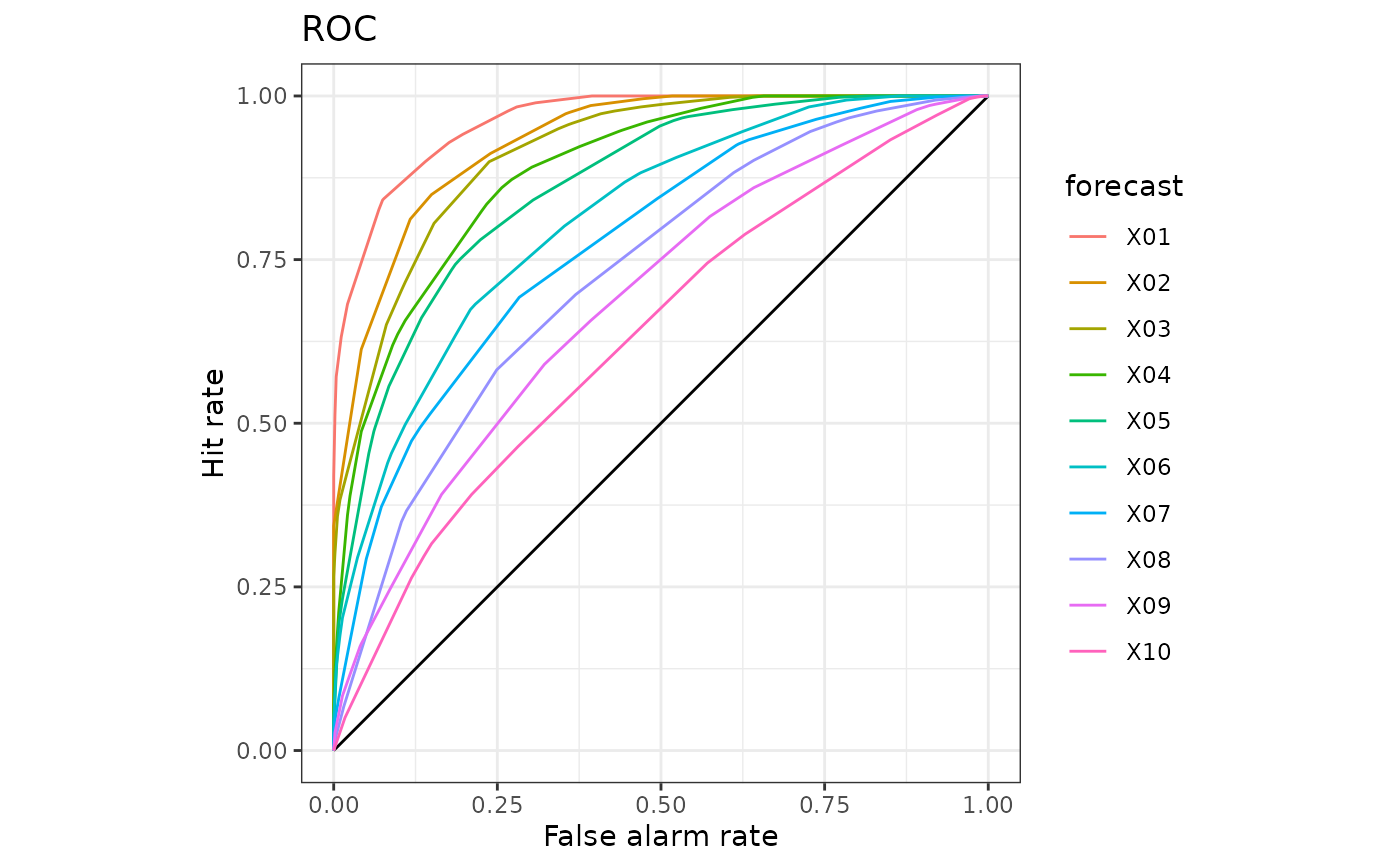
For all other triptych objects: A ggplot object (invisibly).
Every plot() method wraps the corresponding autoplot() method,
followed by an explicit print() call.
That is, it always draws a plot, even during assignment or within a loop.
