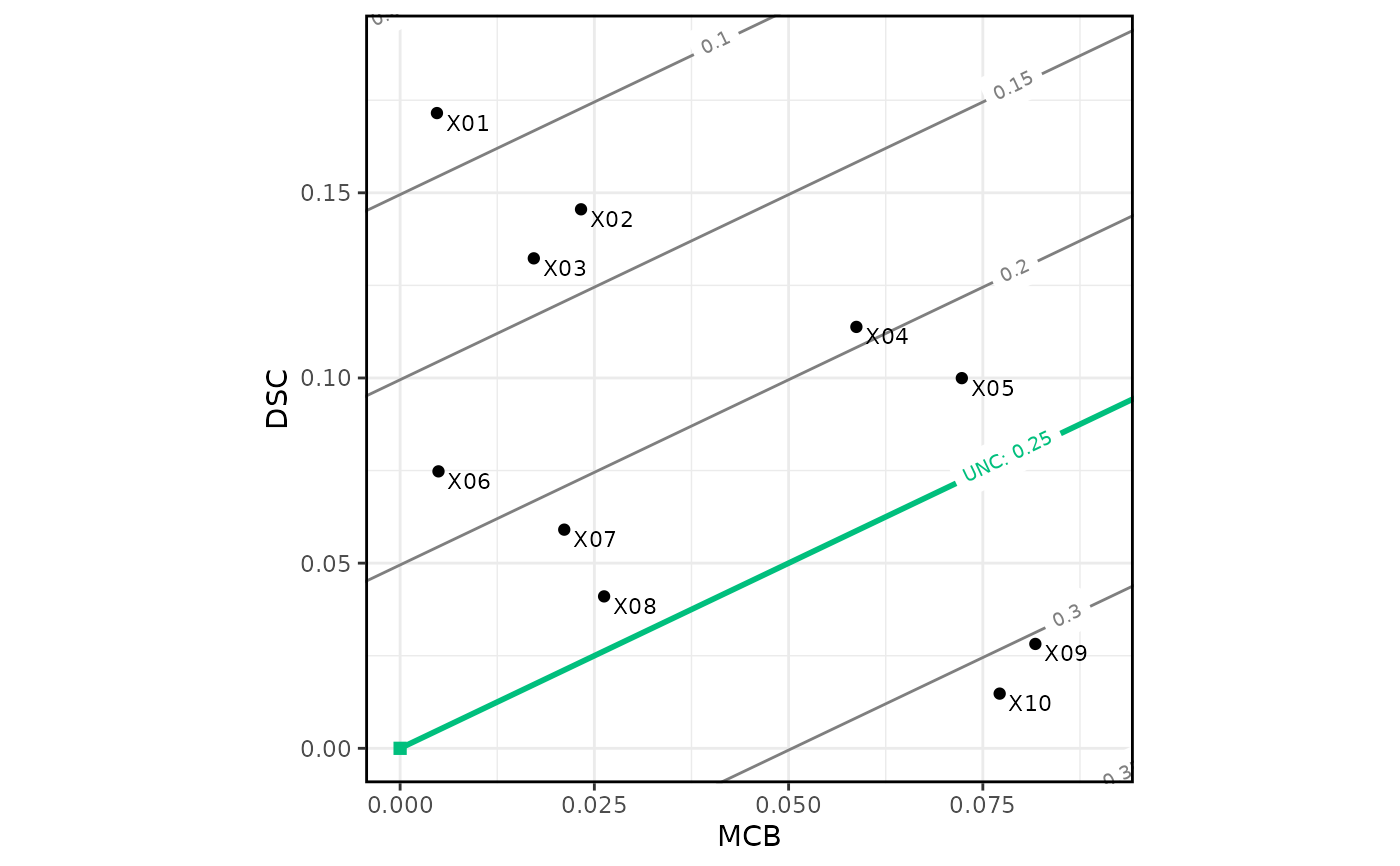
A score decomposition splits the mean score into the three components of miscalibration (MCB), discrimination (DSC), and uncertainty (UNC). Plotting the DSC component against the MCB component allows for a quick visual inspection of predictive performance for many forecasting methods.
Arguments
- x
A data frame, list, matrix, or other object that can be coerced to a tibble. Contains numeric forecasts, and observations (optional).
- y_var
A variable in
xthat contains observations. Specified as the argumentvarindplyr::pull().- ...
Unused.
- y
A numeric vector of observations. If supplied, overrides
y_var. Otherwise, defaults todplyr::pull(x, y_var).- score
A string specifying the score function. One of:
"Brier_score"(default),"log_score","MR_score".- r
A reference triptych_mcbdsc object whose attributes are used for casting.
Value
A triptych_mcbdsc object, that is a vctrs_vctr subclass, and has
a length equal to number of forecasting methods supplied in x. Each entry
is named according to the corresponding forecasting method,
and contains a list of named objects:
estimate: A data frame of the score decomposition.region: An empty list. Adding confidence regions is not yet supported.x: The numeric vector of original forecasts.
Access is most convenient through estimates(), regions(), and forecasts().
See also
Accessors: estimates(), regions(), forecasts(), observations()
Visualization: plot.triptych_mcbdsc(), autoplot.triptych_mcbdsc()
Examples
data(ex_binary, package = "triptych")

md <- mcbdsc(ex_binary)
md
#> <triptych_mcbdsc[10]>
#>             X01             X02             X03             X04             X05
#> <named list[3]> <named list[3]> <named list[3]> <named list[3]> <named list[3]>
#>             X06             X07             X08             X09             X10
#> <named list[3]> <named list[3]> <named list[3]> <named list[3]> <named list[3]>

autoplot(md)

estimates(md)
#> # A tibble: 10 × 5
#>    forecast mean_score     MCB    DSC   UNC
#>    <chr>         <dbl>   <dbl>  <dbl> <dbl>
#>  1 X01          0.0827 0.00474 0.172  0.250
#>  2 X02          0.127  0.0233  0.146  0.250
#>  3 X03          0.134  0.0172  0.132  0.250
#>  4 X04          0.194  0.0587  0.114  0.250
#>  5 X05          0.222  0.0723  0.100  0.250
#>  6 X06          0.180  0.00494 0.0748 0.250
#>  7 X07          0.212  0.0211  0.0590 0.250
#>  8 X08          0.235  0.0263  0.0410 0.250
#>  9 X09          0.303  0.0818  0.0282 0.250
#> 10 X10          0.312  0.0772  0.0148 0.250