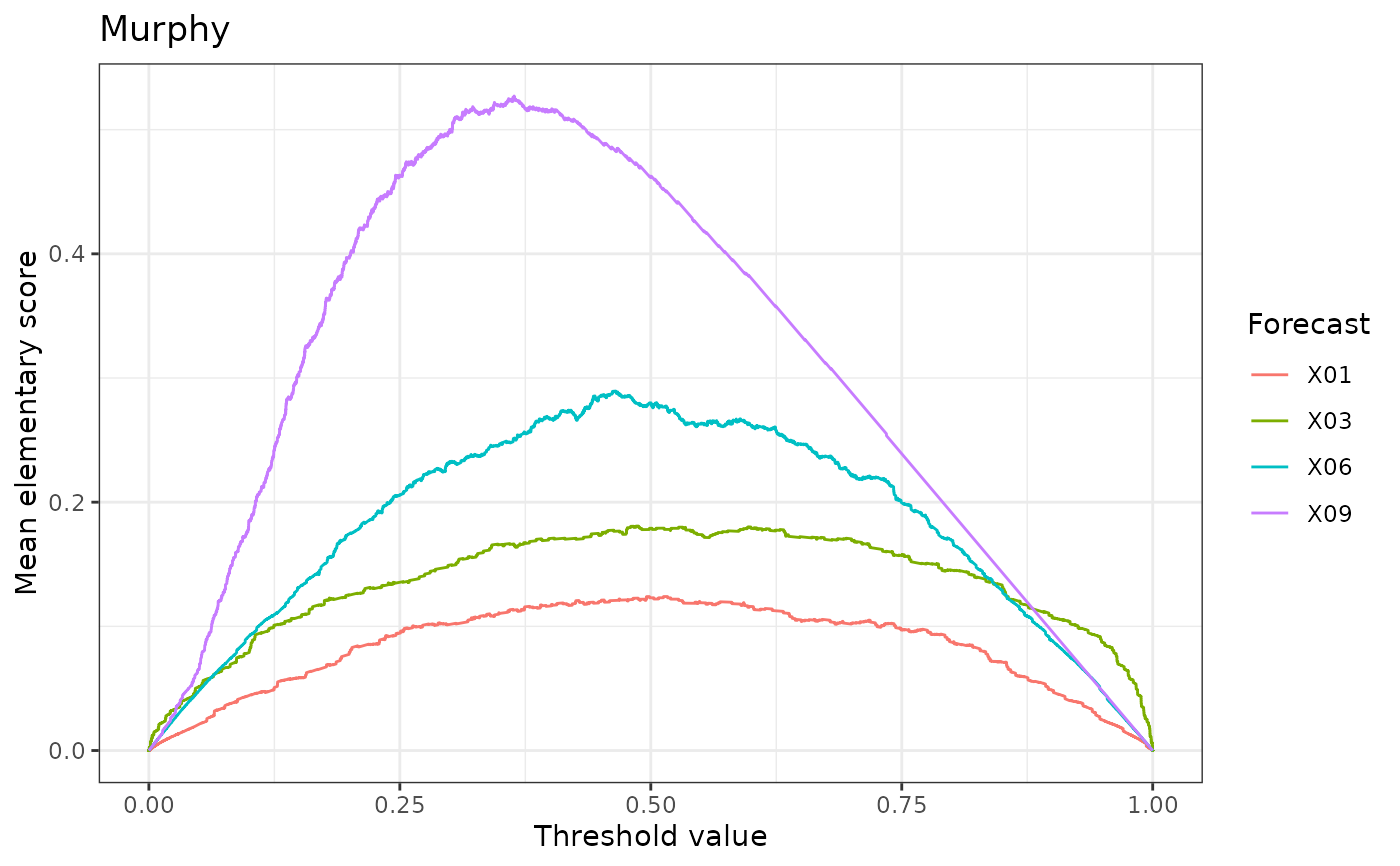
A Murphy curve visualizes economic utility by displaying the mean elementary scores across all threshold values.
Arguments
- x
A data frame, list, matrix, or other object that can be coerced to a tibble. Contains numeric forecasts, and observations (optional).
- y_var
A variable in
xthat contains observations. Specified as the argumentvarindplyr::pull().- ref_var
A variable in
xthat contains reference forecasts. Specified as the argumentvarindplyr::pull()). Ignored, if the default name is not present inx.- ...
Unused.
- y
A numeric vector of observations. If supplied, overrides
y_var. Otherwise, defaults todplyr::pull(x, y_var).- ref
A numeric vector of reference forecasts. If supplied, overrides
ref_var. Otherwise, ignored (seeref_var) ordplyr::pull(x, ref_var).- r
A reference triptych_murphy object whose attributes are used for casting.
Value
A triptych_murphy object, that is a vctrs_vctr subclass, and has
a length equal to number of forecasting methods supplied in x. Each entry
is named according to the corresponding forecasting method,
and contains a list of named objects:
estimate: A data frame with the threshold and corresponding mean score values.region: Either an empty list, or a data frame of point confidence intervals added byadd_confidence().x: The numeric vector of original forecasts.
Access is most convenient through estimates(), regions(), and forecasts().
See also
Accessors: estimates(), regions(), forecasts(), observations()
Adding uncertainty quantification: add_confidence()
Visualization: plot.triptych_murphy(), autoplot.triptych_murphy()
Examples
data(ex_binary, package = "triptych")
mr <- murphy(ex_binary)
mr
#> <triptych_murphy[10]>
#> X01 X02 X03 X04 X05
#> <named list[3]> <named list[3]> <named list[3]> <named list[3]> <named list[3]>
#> X06 X07 X08 X09 X10
#> <named list[3]> <named list[3]> <named list[3]> <named list[3]> <named list[3]>
# 1. Choose 4 predictions
# 2. Visualize
# 3. Adjust the title of the legend
mr[c(1, 3, 6, 9)] |>
autoplot() +
ggplot2::guides(colour = ggplot2::guide_legend("Forecast"))
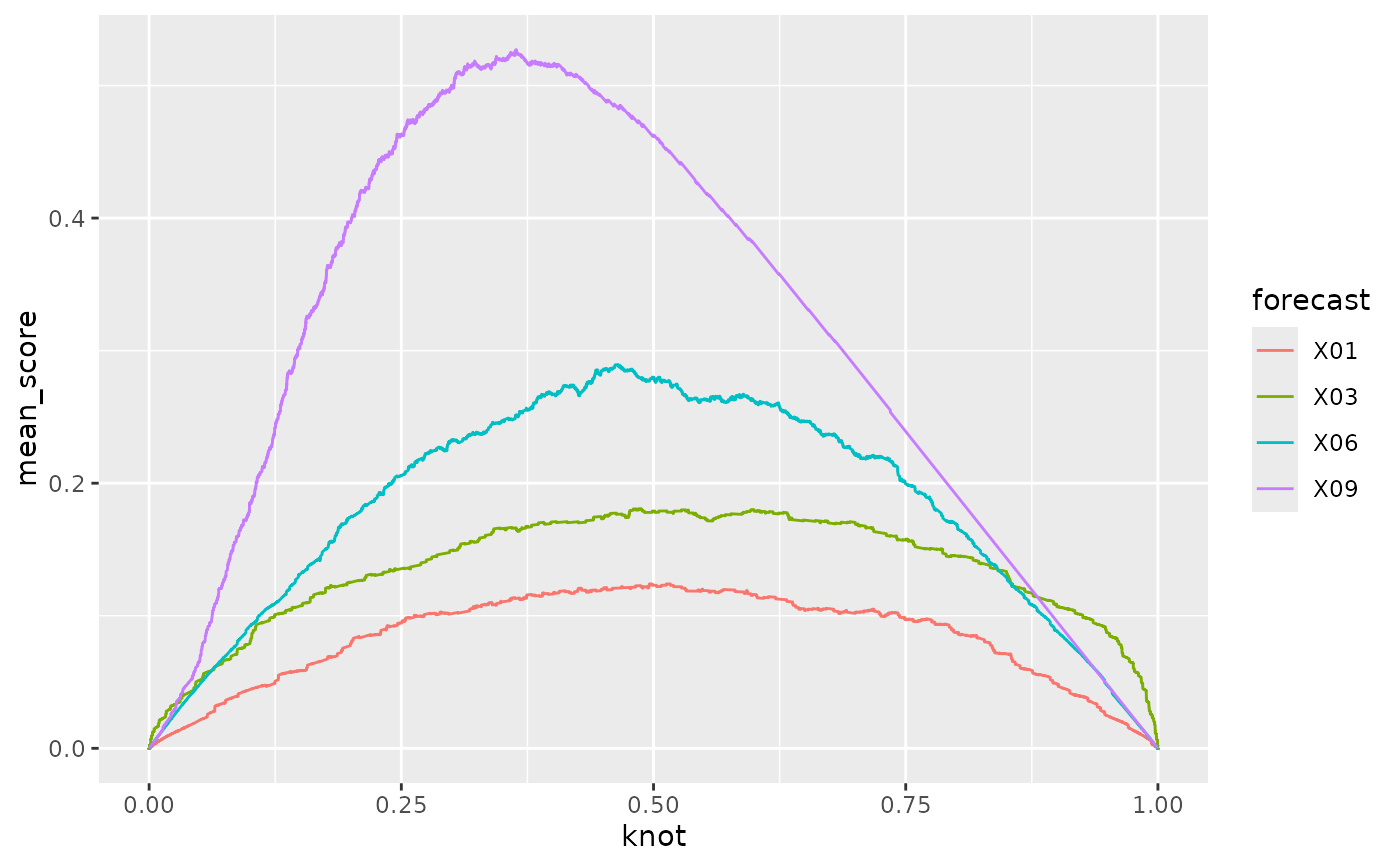
 # Build yourself using accessors
library(ggplot2)
df_est <- estimates(mr[c(1, 3, 6, 9)])
ggplot(df_est) +
geom_path(aes(x = knot, y = mean_score, col = forecast))
# Build yourself using accessors
library(ggplot2)
df_est <- estimates(mr[c(1, 3, 6, 9)])
ggplot(df_est) +
geom_path(aes(x = knot, y = mean_score, col = forecast))